
Figure 6.
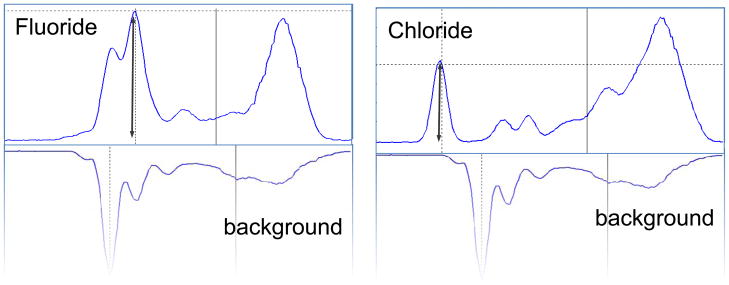
ESI-DMS of water samples of fluoride (H2O)F− and chloride (Cl−) (10 ppm) compared to solvent background (50/50 ACN/water) in the offline nanospray-DMS orifice system of Figure 2. Additional results are shown in Table 2. The rightmost peak in each case is a dimer and solvent cluster peak that would be decreased with heated reaction chamber desolvation and lower concentrations.