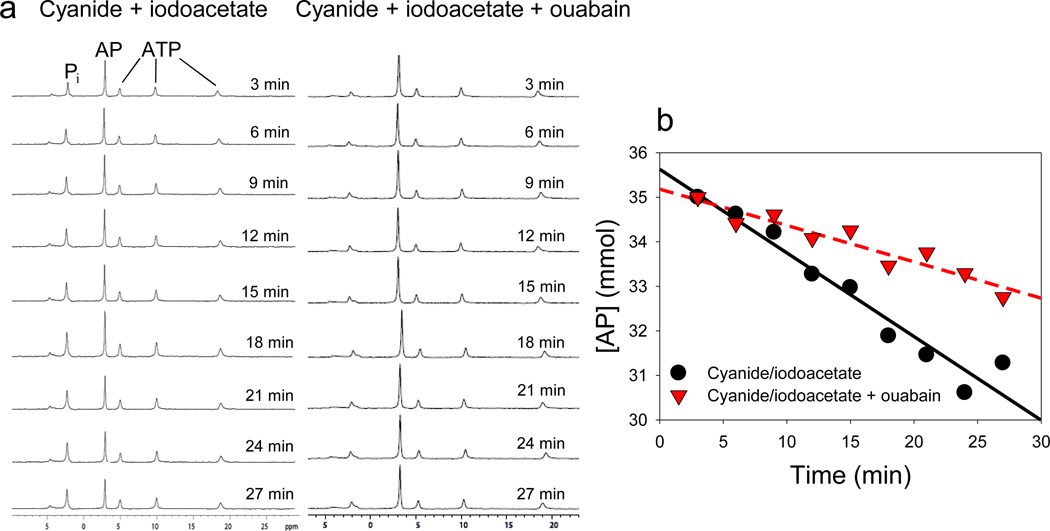
Figure 1.
Example of 31P-NMR measurement of AP depletion rates. Representative experiment showing changes over time in (a) NMR spectra and (b) AP concentration during treatment with CN and IA or CN, IA and OU. The AP depletion rate was higher when energy metabolism alone was blocked with CN and IA than when energy metabolism and the Na+-K+-ATPase were inhibited with CN, IA and OU. The CN and IA treatment yields the total ATP demand, and the difference between slopes is the ATP cost of the Na+-K+-ATPase in isolated resting muscle.

