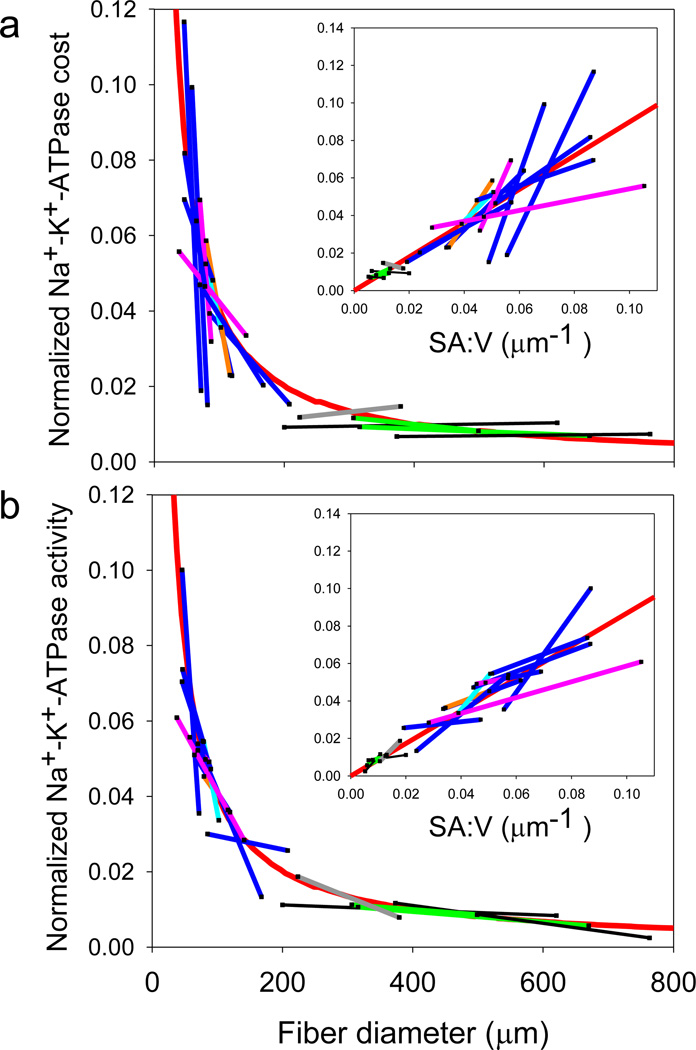
Figure 2.
Na+-K+ ATPase cost and enzymatic activity during hypertrophic fiber growth. (a) Absolute Na+-K+ ATPase cost and (b) maximal enzymatic activity, normalized to fit all species on a single plot. The straight colored lines connect the mean values for the small and large size classes (for visualization purposes only) and show that the changes in cost and activity during hypertrophic growth follow the pattern predicted for SA:V (red line) over a wide fiber size range. The data were normalized by dividing the absolute cost of the Na+-K+ ATPase (Table 2) by the adjustable coefficient, α, the value of which was determined for each species from an iterative curve fit as described in Supplemental Figure S1, allowing all data to be plotted in a single graph. The line color represents species group (pink = marine shrimp, green = marine lobster, gray = freshwater crayfish, black = marine crab, blue = marine teleost fish, cyan = freshwater teleost fish, and orange = marine elasmobranch). The insets are the same data plotted as a linear function of SA:V (linear regression equations: normalized cost = 0.942(SA:V) + 0.002, r2=0.72, p<.0001 (t-test, n=32); normalized activity = 0.812(SA:V) + 0.003, r2=0.86, p<0001 (t-test, n=32)).

