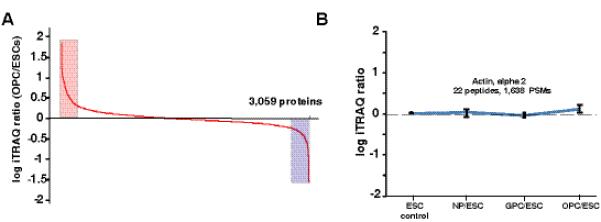
Fig 3. The distribution of iTRAQ fold changes.

A) Proteins expression levels observed between ESCs and OPCs. B) Average ratios of expression of actin alpha 2 in four different cell stages calculated using ~1,650 peptide-spectrum matches (PSMs)

A) Proteins expression levels observed between ESCs and OPCs. B) Average ratios of expression of actin alpha 2 in four different cell stages calculated using ~1,650 peptide-spectrum matches (PSMs)