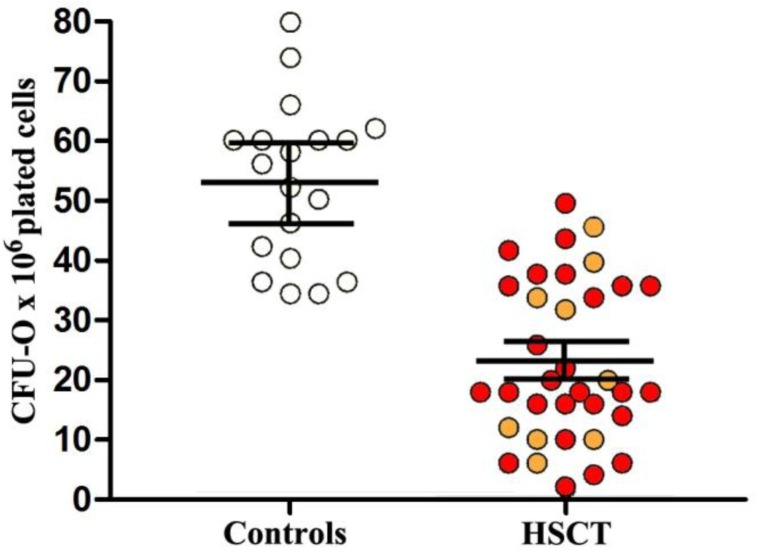
Fig. 2.
Number of colony forming units-osteogenic progenitors (CFU-O) in hematopoietic stem cell transplantation (HSCT) recipients and normal controls.
Each orange and red dot represents an auto- and allo-HSCT recipient. Horizontal bars represent mean values, vertical bars represent the standard error of mean.

