Figure 2.
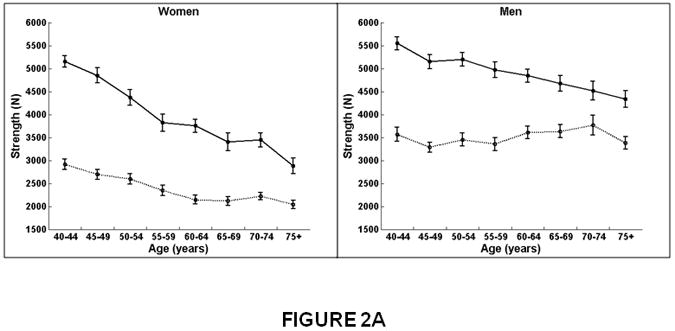
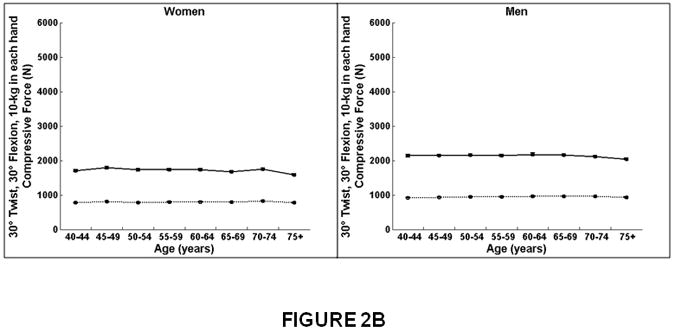
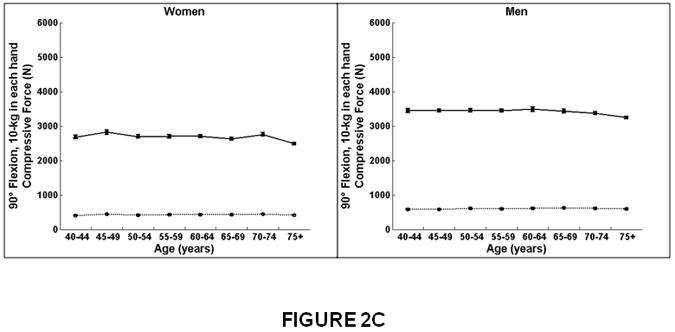
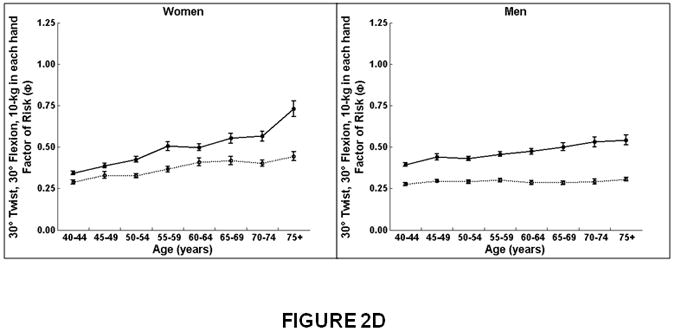
Association between age and compressive strength, compressive force, and factor-of-risk for the thoracic (T8-T10) and lumbar (L3-L5) spine in women and men. Mean values for the thoracic and lumbar spine, averaged for T8-T10 and L3-L5, respectively, are shown. Compressive strength declined with increasing age for the lumbar and thoracic spine in women. In men, compressive strength declined with increasing age for the lumbar spine but did not change with increasing age for the thoracic spine. Compressive force declined with increasing age for the lumbar spine in women and men but did not change with increasing age at the thoracic spine. Factor-of-risk increased with age for the lumbar and thoracic spine in women, whereas the factor-of-risk increased with age only for the lumbar spine and not in the thoracic spine in men.
Women on left, men on right.
X-axis, age in years.
Y-axis, QCT bone measures, (A) Compressive strength (B) Compressive force, twisting and flexion, (C) Compressive force, standing and flexion, (D) Factor-of-risk, twisting and flexion (E) Factor-of-risk, standing and flexion.
Solid line, values for lumbar spine, averaged for L3-L5 vertebral levels.
Dotted line, values for thoracic spine, averaged for T8-T10 vertebral levels.