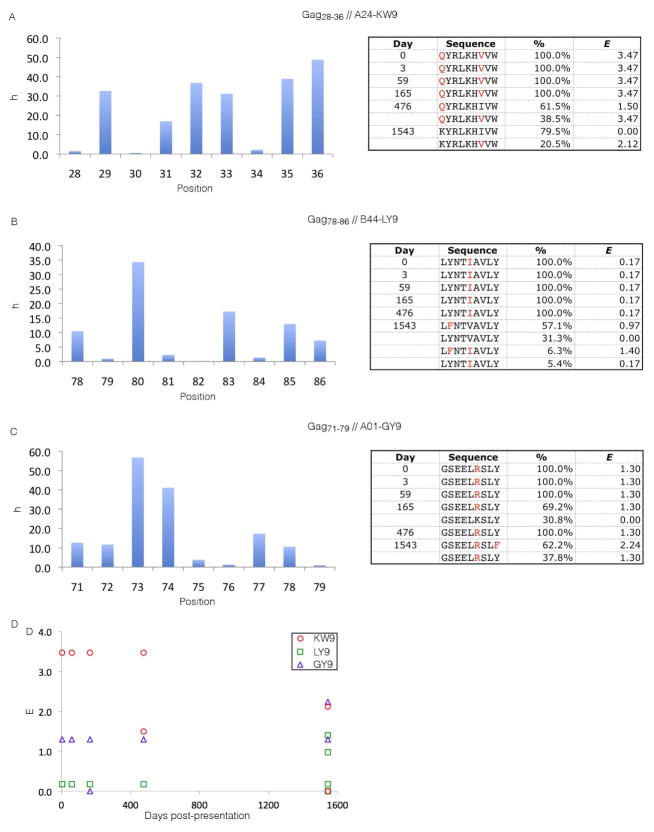
Figure 5.
Longitudinal deep sequencing within a single infected host identified three p17 CTL Gag epitopes as undergoing sequence adaptation during the first four years of HIV infection (Henn et al., 2012). In panels A–C, the title provides the location of each CTL epitope within Gag (e.g., Gag28-36), the HLA association (e.g., A24), and the name of the epitope (e.g., KW9). On the left side we present bar charts illustrating our inferred h parameter (c.f. Computational and Experimental Procedures) at each position in the epitope. On the right, we list the strains observed by deep sequencing at the six time points (Henn et al., 2012), the fraction of the deep sequencing reads corresponding to each strain (Henn et al., 2012), and the energy of each strain assigned by our model. Red letters indicate point mutations relative to our MSA consensus; all residues outside the epitope are treated as wild-type in the computation of energies from our model. In panel D, we present the temporal adaptation courses tracking the energy assigned by our model to the mutant strains of each epitope sequenced at each time point.(A) The infecting strain contains two mutations in the KW9 epitope (Gag28-36) at positions 28 and 34, corresponding to the positions with the second (h28 = 1.50) and third (h34 = 2.12) lowest h values and a compensatory J coupling (J28,34 = −0.15, c.f. Computational and Experimental Procedures), lowering the energy of the double mutant relative to the two independent point mutations. By day 476, 61.5% of the viral population has reverted to the lower energy single mutant (h28 = 1.50). By day 1543, 79.5% of viral strains have reverted to the lowest energy (E=0) wild-type state. The remaining 20.5% occupy the third least costly singly mutated state (h34 = 2.12). The lowest (h30 = 0.55), second lowest (h28 = 1.50) and third lowest (h34 = 2.12) singly mutated states are similar in energy.(B) The LY9 epitope (Gag78-86) enters with a single mutation in the infecting strain at the single lowest energy position (h82 = 0.17). No sequence adaptation is observed until day 1543, at which time 31.3% of the population has reverted to the lowest energy (E=0) wild-type. 57.1% of the population occupy the second lowest energy singly mutated state (h79 = 0.97), while 6.3% occupy a low energy doubly mutated state (h79 = 0.97, h82 = 0.17, J79,82 = 0.25), and 5.4% remain in the infecting state. (C) The GY9 epitope (Gag71-79) entered with a single mutation at the second least costly position in the epitope (h76 = 1.30), nearly equi-energetic with the least costly point mutation (h79 = 0.97). By day 165, the wild-type strain transiently emerged in 30.8% of the population, but has vanished by day 476. At day 1543, 37.8% of the population remains in the infecting state. The remaining 62.2% possess mutations at the second least costly (h79 = 0.97) and least costly (h76 = 1.30) positions, and a small compensatory coupling (J76,79 = −0.04). This double mutant is of very low energy, lying within the lowest 1% of all 8,646 possible p17 double mutants. Of the three epitopes considered, only for GY9 is a significant fraction of the day 1543 population not observed in the lowest energy wild-type state, although it transiently emerges in day 165. Of the three epitopes, GY9 was the only one against which a CTL response was reported (Henn et al., 2012), consistent with a situation in which the wild-type state is effectively less fit than a competing mutant strain capable of evading immune pressure.(D) Temporal adaptation courses follow high fitness (low energy) routes for each of the three epitopes: KW9 (red circles), LY9 (green squares), and GY9 (blue triangles).

