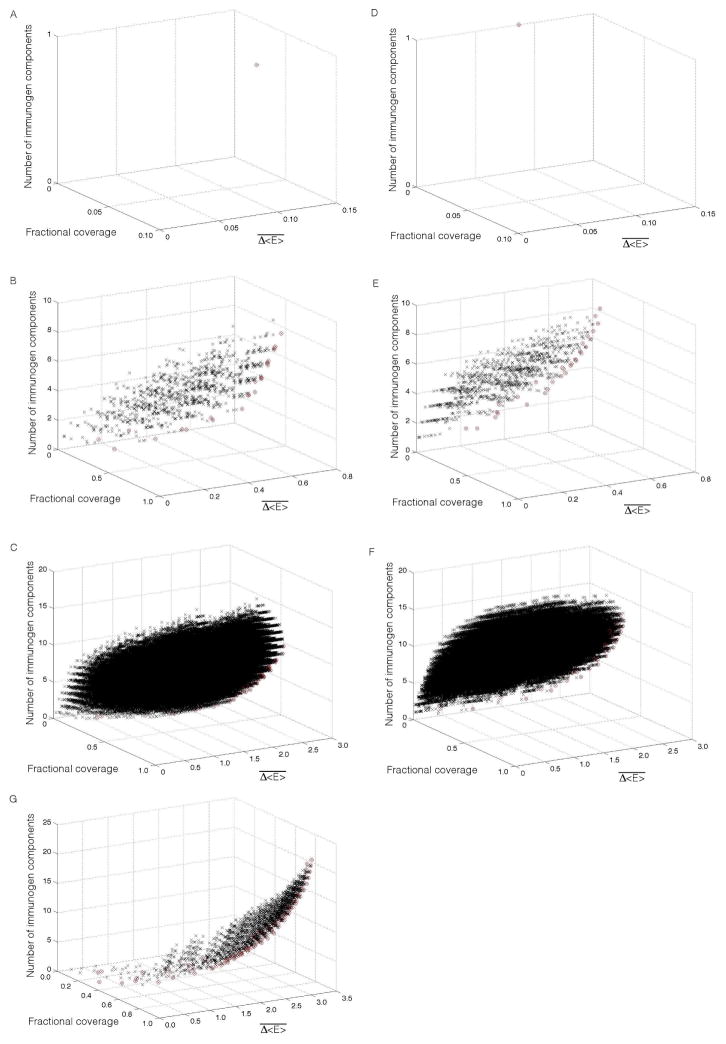
Figure 7.
Evaluation of immunogen candidates. (A–C) Scatter plots of (A) p6, (B) p17 and (C) p24 vaccine candidates in the three-dimensional design space spanned by: (i) the weighted average fitness impact in the target population, , (ii) fraction of the target population that respond to at least one epitope in the immunogen (fractional coverage), and (iii) the number of components in the vaccine. The target population comprised the 21 most prevalent haplotypes in North Americans of European ancestry, accounting for 44.6% of this population. Respectively, 1, 1023 and 1,048,575 immunogen candidates were tested for p6, p17 and p24 (black crosses), of which 1, 25 and 44 candidates were located on the Pareto frontier (red circles). The composition of these Pareto efficient immunogens is listed in Tables S3–5. (D–F) Scatter plots analogous to those in panels A–C for (D) p6, (E) p17, and (F) p24, in which criterion (ii) was modified to the fraction of the target population that respond to at least two epitopes in the immunogen; 1, 31 and 62 candidates are located on the Pareto frontier. (G) Scatter plot of the 2,340 combination Gag vaccine candidates in the three-dimensional design space spanned by: (i) the weighted average fitness impact in the target population, , (ii) fraction of the target population that respond to at least one epitope in the immunogen (fractional coverage), and (iii) the number of components in the vaccine. The compositions of the 95 Pareto efficient candidates are listed in Table S6.

