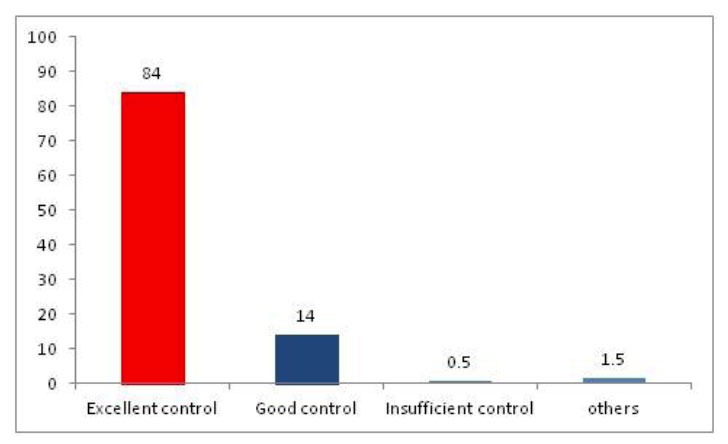
Figure 2.

The figure shows the percentage of time during which different zones of analgesia control occurred for all surgeries (Excellent control represents an analgoscore between −3 and 3, good control represents analgoscore ranging from −6 to −3 and from 3 to 6 and insufficient control represents analgoscore ranging from −9 to −6 and from 6 to 9).
