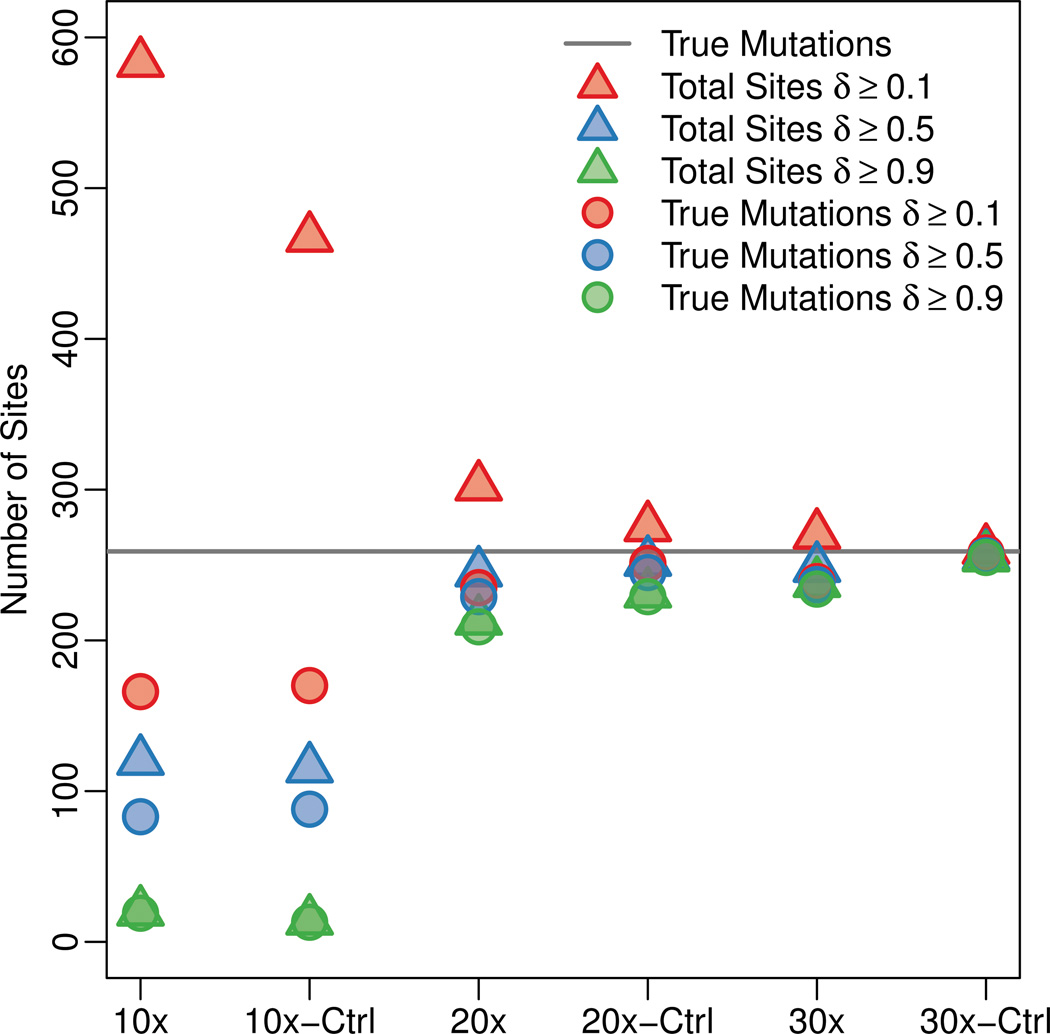
Figure 6.
De novo mutations predictions from trio simulations. 259 sites contained de novo mutations in the simulations (gray line). The total number of mutation calls at three different levels of δ are given by the triangles for each simulation. The circles indicate the amount of true positives for each δ threshold. The distances between triangles and circles represent the amount of false positives, and the distances between the circles and gray line gives the number of false negatives. The “-Ctrl” columns contain results for simulations in which all reads are perfectly aligned back to the reference genome.

