Figure 4.
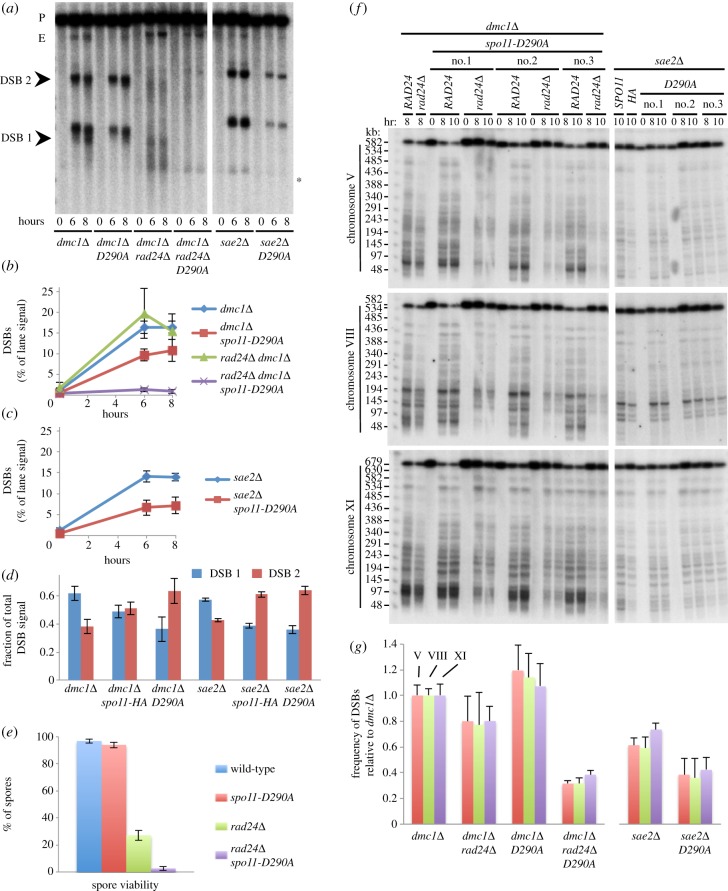
Synergistic reduction in meiotic DSBs in rad24Δ spo11-D290A strains. (a) Genomic DNA was isolated at the indicated time points from synchronous cultures of the indicated strains, digested with PstI, fractionated on a 0.7% agarose gel, transferred to nylon membrane and hybridized with the MXR2 probe. Arrowheads indicate DSB signals; asterisk indicates non-specific band; P, parental band; E, ectopic recombinant. (b,c) Quantification of the total DSB signal (DSB 1 + DSB 2) shown in (a) plotted as a percentage of total lane signal. (d) Proportion of DSB signal present in DSB 1 and DSB 2 for the indicated strains. (e) Spore viability displayed as total viability for the indicated strains. Error bars are 95% confidence limits. (f) Intact chromosomal DNA was isolated at the indicated time points from synchronously sporulating meiotic cultures, separated by PFGE, transferred to a nylon membrane and sequentially hybridized using a radiolabelled fragment of a gene close to the left telomere of each chromosome (chr V = RMD6; chr VIII = CBP2; chr XI = JEN1). Presented gel shows experiment in triplicate. Intact, full-length chromosomes migrate near the top of the gel. DSBs signals appear as the shorter, faster-migrating bands/molecules present in the 8–10 h time points. (g) Quantification of total DSB signals in each lane expressed as a fraction of total lane signal. Measured signals were adjusted to account for the likelihood of multiple DSBs occurring on the same molecule (see material and methods). Because the absolute frequency of DSB formation varies with chromosome, calculated average frequencies (±s.d.) are plotted relative to dmc1Δ to aid easier strain-to-strain comparison.

