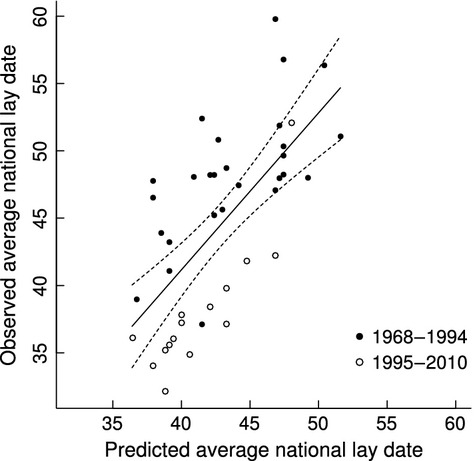
Figure 5.

Predictions of national average lay date derived from the local climatic model (average lay date in response to March temperature), compared with observed national average lay dates, 1968–2010 (filled circles: 1968–1994; open circles: 1995–2010). Observed and predicted dates are strongly correlated (solid line: r40 = 0.68; P < 0.001), and the slope of this relationship is close to unity (1.17 ± 0.20); dashed lines represent 95% confidence intervals. Predictive capacity is similar when restricting prediction to those years that were not represented in the local model (i.e., 1968–1994; filled circles; r25 = 0.63; P < 0.001). Day one represents 1 March.
