
Figure 1.
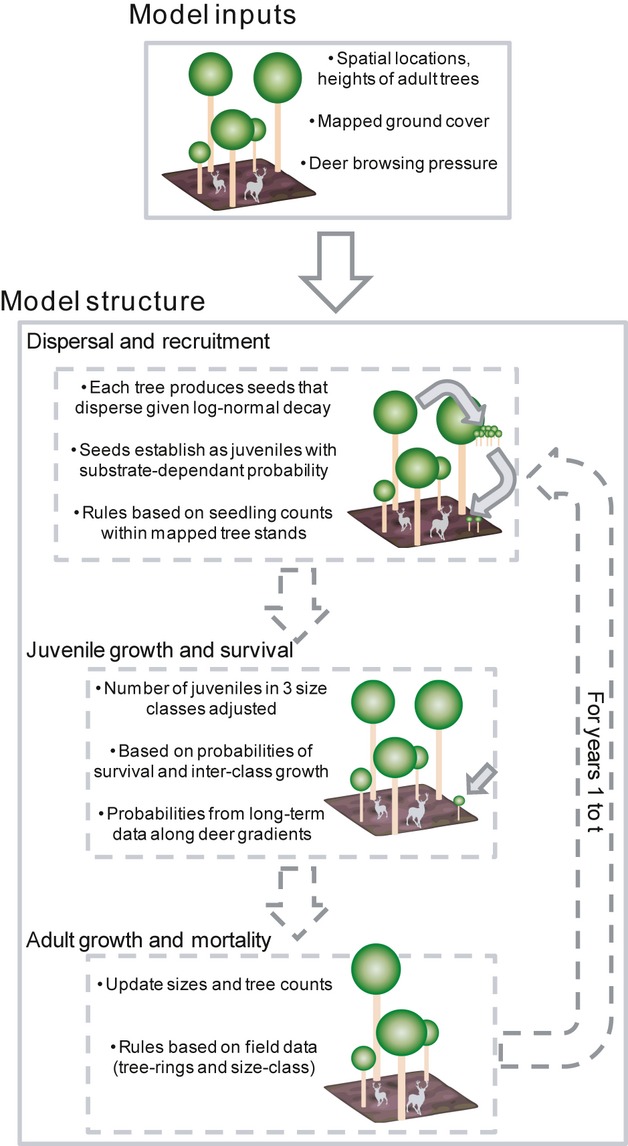
Outline of simulation model. Data used to parameterize each submodel denoted by hashed boxes. Inputs are fed to the model, which loops across the individual submodels for 1 to t years, after which the coordinates and heights of all trees in the landscape are output. We imposed two additional rules upon the model: (A) adult trees were also removed from the simulation when their crowns were 90% overtopped by neighbors; and (B) newly established juvenile trees could not progress to the taller height tier the following year.