
Figure 2.
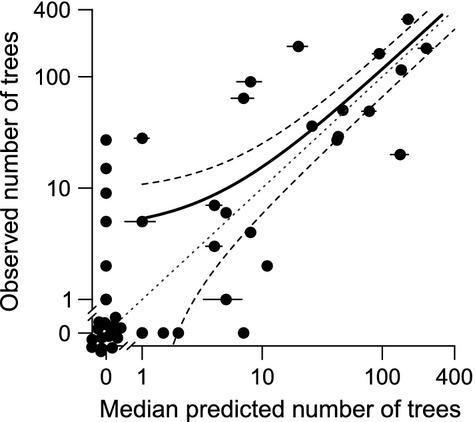
Model validation by comparing observed and predicted number of trees within fifty 2 × 100 m plots at Creag Meagaidh in 2000. Predicted values represent medians ± standard errors given 1000 simulations from adult tree locations in 1990. Dotted line denotes 1:1 relationship, while solid line represents fitted model between predicted and observed values ± 95% CIs. Equation of line: y = 4.21 + 1.13x; 22 plots with 0 trees observed and values were jittered for clarity.