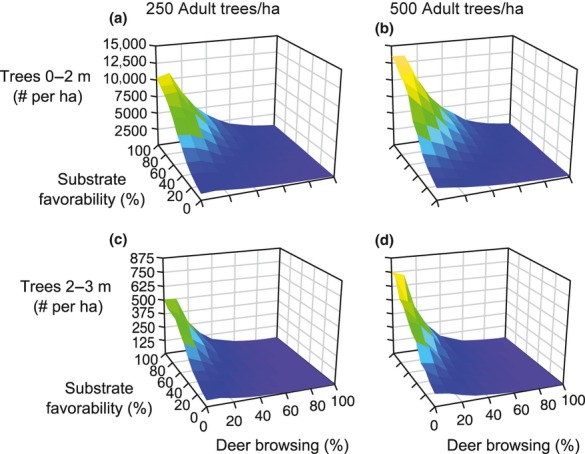
Figure 3.

Numbers of juvenile trees in (A, B) 0–2 and (C, D) 2–3 m height tiers predicted after 30 years from initial densities of adult trees of either (A, C) 250 trees ha−1 or (B, D) 500 trees ha−1. Both substrate favorability and deer browsing varied in 10% intervals, and we performed 100 simulations at each combination of these two factors (n = 121). Plotted values represent means of 100 simulations; 95% CIs in Figures S1–S2.
