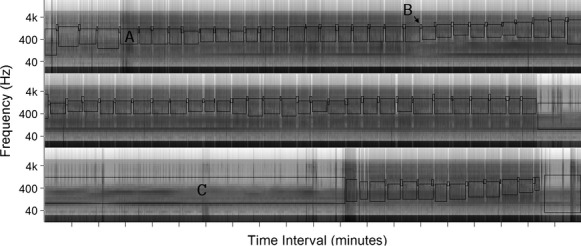
Figure 2.

Spectrogram displaying 1 h (1:00–2:00 am) of data collected from a collar-mounted recorder plotted over three 20-minute lines. The Y-axis corresponds to frequency on a logarithmic scale spanning a range of 12.5 Hz–20 kHz. The shading scale represents intensity of sound level. Quiet background sound levels are assigned lighter shades and sound events are assigned darker shades. The duration of distinct classes of behavior in this spectrogram have been annotated with black boxes. This hour was dominated by 75 repeated chewing events (A) that were punctuated by an equal number of pauses (B). During the long (775 sec) event (C), the deer is largely inactive and likely bedded down.
