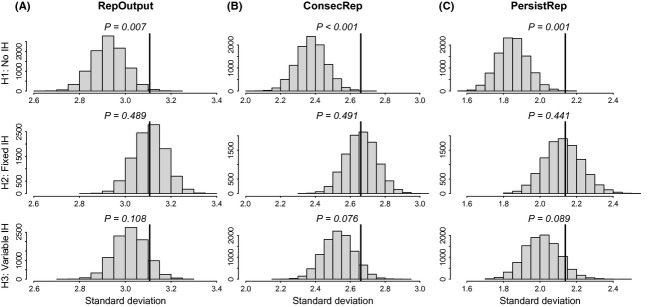
Figure 4.

Posterior predictive distributions of the interindividual standard deviation of (A) observed reproductive output (RepOutput), (B) number of transitions from state E to state E (ConsecRep), and (C) maximum persistence in state E (PersistRep), for each model (each row). The standard deviation value from observed data is shown by the vertical black line and the posterior predictive one-sided P-value is also displayed above each plot. This posterior predictive analysis was restricted to individuals having a minimum lifetime window of at least 5 years.
