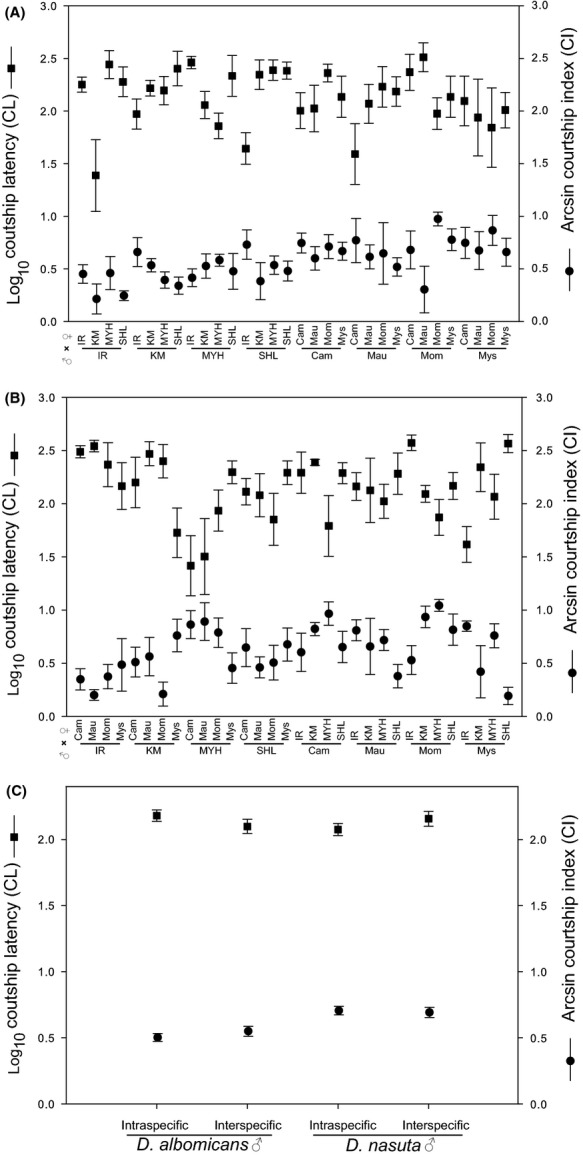
Figure 1.

Courtship latency (CL, left Y axis) and courtship index (CI, right Y axis) of males in intra and interspecific pairwise trials  among four strains from each of the two species Drosophila albomicans and D. nasuta. (A) CL and CI in the 32 intraspecific combinations. (B) CL and CI in interspecific combinations. (C) Average of CL and CI for each species with regard to intraspecific and interspecific combinations. CL is Log10 and CI is Arcsine transformed. Error bar represents 1 × SEM. See Methods for the strain name abbreviations.
