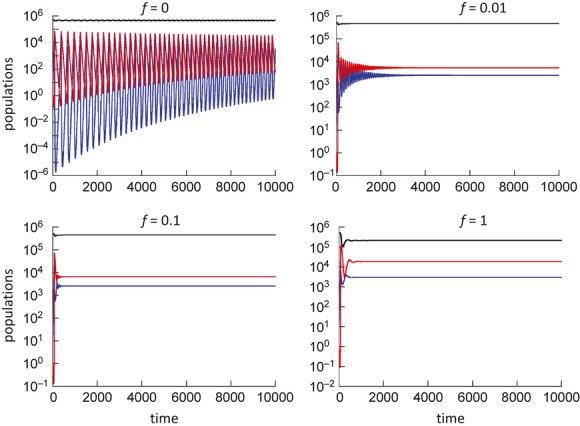
Figure 2.

Dynamics predicted by model (1), depending on the virophage pathogenicity, f. The host population is shown in black, cells infected with the primary virus in blue, and cells infected with the virophage in red. The more the virophage inhibits the primary virus (lower f), the more unstable the dynamics become, leading to more extensive oscillations and longer damping times. Parameters were chosen as follows. r = 0.01; β1 = 2.5 × 10⁻⁷; a1 = 0.01; β2 = 2 × 10⁻⁵; aph = 0.05; k = 5 × 10⁵.
