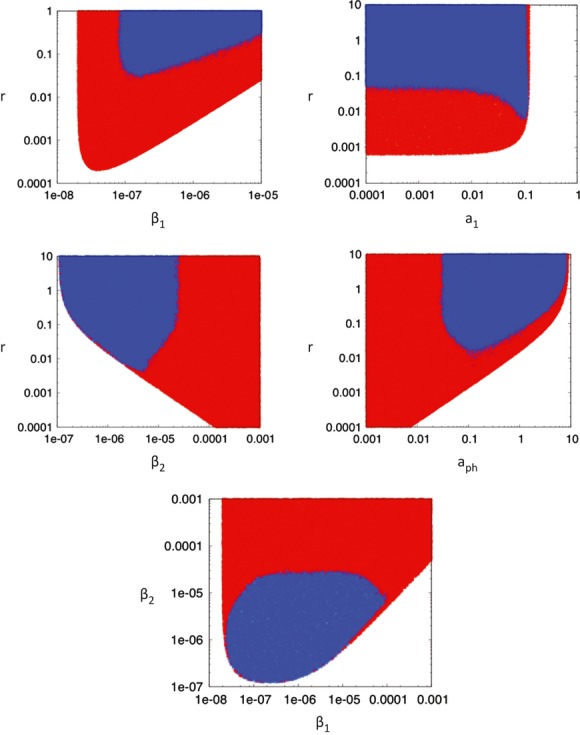
Figure 6.

Extinction versus persistence of a virophage with maximal pathogenicity (f = 0) in dependence of model parameters. The graphs are based on Gillespie simulations of model (2). Simulations were started at the equilibrium (nearest integer number) according to ODE model (1). The simulations were run until a time threshold of 50,000 time units, and it was recorded whether the populations were extinct (red) or persisted (blue). The parameters indicated in the plots were randomly varied 100,000 times. Note that the borders between extinction and persistence can be fuzzy due to randomness in the outcomes. The exact picture depends on the time threshold when the simulation is stopped. Obviously, any stochastic simulation will end in extinction if it is run for long enough, irrespective of the parameters. However, in the blue parameter region, persistence lasts for a significantly longer time than in the red region. Base parameters were chosen as follows: r = 0.01; β1 = 2.5 × 10⁻⁷; a1 = 0.01; β2 = 2 × 10⁻⁵; aph = 0.05; k = 5 × 10⁵.
