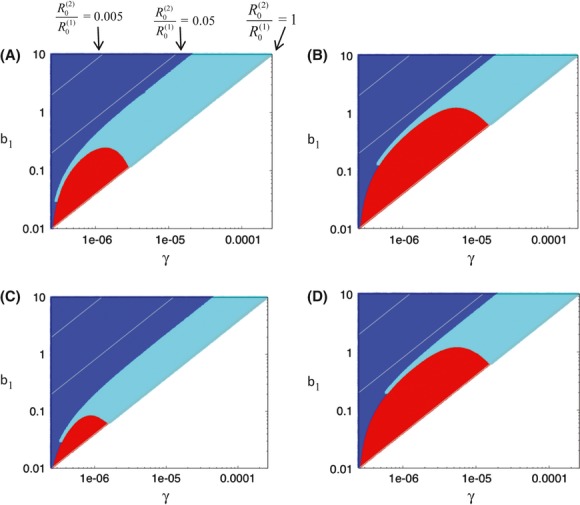
Figure 8.

Outcome of competition between two primary virus strains in the presence of the virophage, depending on the parameter values, according to model (3). Strain 2 is assumed to have a lower basic reproductive ratio, R0, than strain 1. Strain 2 with the lower R0 wins in the red parameter region. Strain 1 wins in the blue parameter region. Coexistence is observed in the cyan parameter region. The gray lines indicate the ratio of R0 for strain 2 over that of strain 1. The lower this ratio, the lower the relative R0 of strain 2. The gray lines show that the ratio of  per se does not determine the outcome of competition (on the lines, the ratio is identical). Different outcomes can be observed for the same ratio
  . The different graphs show the parameter exploration for different parameter values. Panel (A) is the base scenario. Panel (B) assumes a stronger virophage due to a faster virophage replication rate. Because the virophage is stronger, the parameter region in which the primary virus with the lower R0 wins is larger. Panel (D) also shows a stronger virophage, this time indirectly due to a faster replication rate of the host population, demonstrating a similar effect. Panel (C) is done for a relatively low virophage pathogenicity, that is, a high value of f. This reduces the life span of infected cells because of less inhibition of primary virus replication, thus lowering the virophage burst size. Consequently, the parameter region in which strain 2 with the lower R0 wins is reduced. Base parameters were chosen as follows: (A) r = 0.01; β1 = 2.5 × 10⁻⁷; a1 = 0.01; β2 = 2 × 10⁻⁵; aph = 0.1; f = 0.1; k = 5 × 10⁵. (B) Same as (A) except β2 = 2 × 10⁻⁴. (C) Same as in (A) except f = 1. (D) Same as in (A) except r = 0.1.
