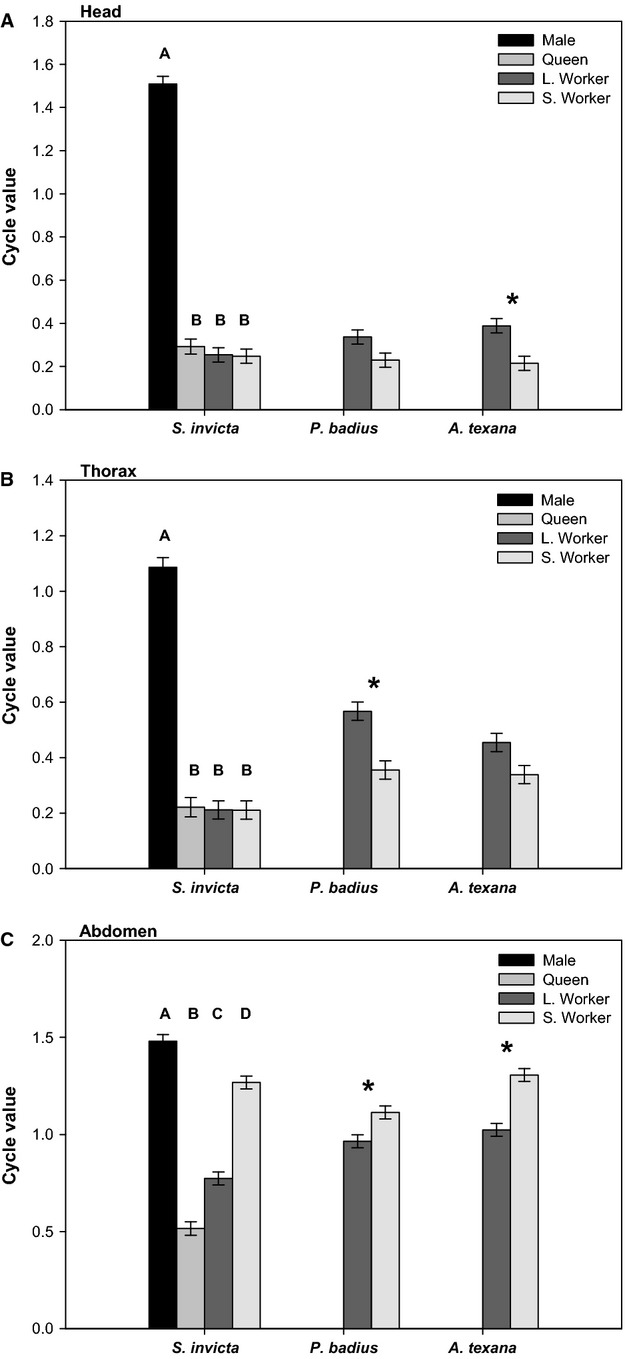
Figure 3.

Cycle values of (A) heads, (B) thoraces, and (C) abdomens of males, queens, large workers, and small workers of each species for which they were sampled. Shown are means ± SE. Letters indicate significance among means in each comparison group and asterisks indicate significance between two means. All significance was determined at α = 0.05.
