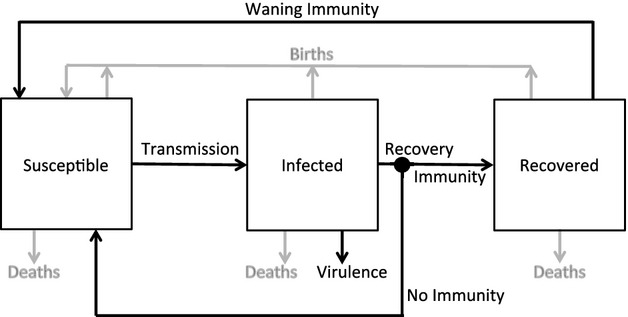
Figure 1.

A schematic of our epidemiological model. The demographic processes of births and deaths are shown with gray lines, and the epidemiological processes of transmission, recovery, virulence, and waning immunity with black lines. The key “event” in our model is marked by the dot, where recovering hosts will either gain immunity and move to the recovered class, or will gain no immunity and return to the susceptible class.
