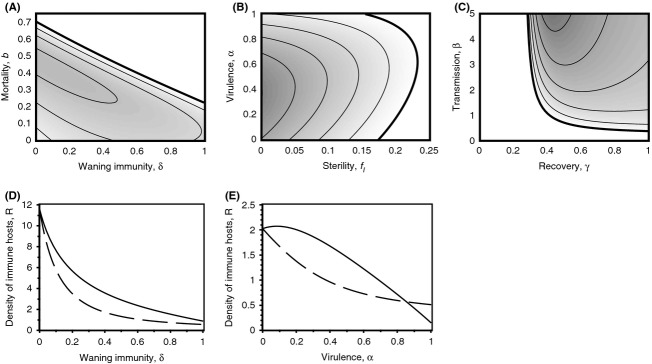
Figure 3.

The continuously stable strategies (CSSs) level of investment in immunity. White regions indicate no immunity (μ = 0) with darker shadings indicating a greater level of immunity. For clarity, we plot contours for every 0.1 increment in investment (the bold line gives the μ = 0 contour). (A) Varying death rate, b, and waning immunity, (δ) (B) varying virulence, α, and sterility, f1 (C) varying recovery, γ, and transmission, β. We also show plots for how the density of immune hosts at the CSS (solid line) and a fixed level of μ (dashed line) for varying (D) waning immunity, δ, and (E) virulence, α. Default parameter values are as of figure 1 with λ = 2. In (D) b = 0.1.
