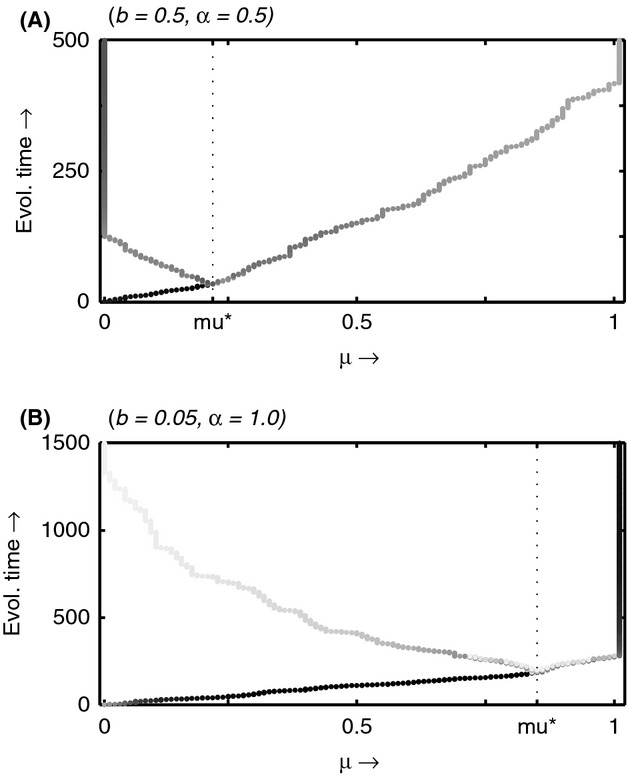
Figure 5.

Numerical simulation of the evolution of immunity. In each case, we start at μ = 0 (representing no immunity in the population), it evolves toward a branching point and the population splits into two. The shading represents the density of the population (darker = higher). In (A) the resistant branch has a lower density than the nonresistant branch, whereas in (B) the resistant branch has a higher density. Default parameter values as of Figure 1, but with δ = 0.05. In (B) α = 1, b = 0.05.
