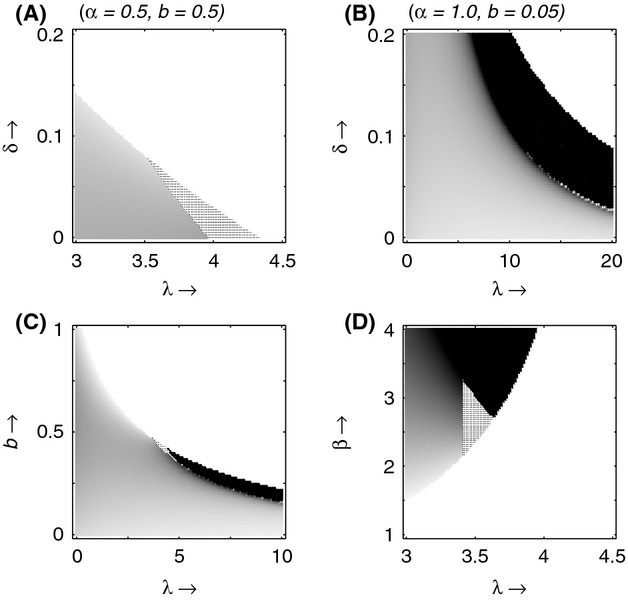
Figure 6.

Plot of the evolutionary outcome, with hosts initially having no immunity, μ = 0 for varying trade-off curvature, λ and epidemiological parameters. Plots (A) and (B) show λ versus δ (waning immunity), with α = 0.5, b = 0.5 in (A) and α = 1, b = 0.05 in (B). Plot (C) shows λ versus b (death rate) and plot (D) shows λ versus β (transmission). The shading represents the level of immunity invested in (white = none, black = full) and the dotted region represents branching. Default parameter values are as of Figure 1.
