Figure 1.

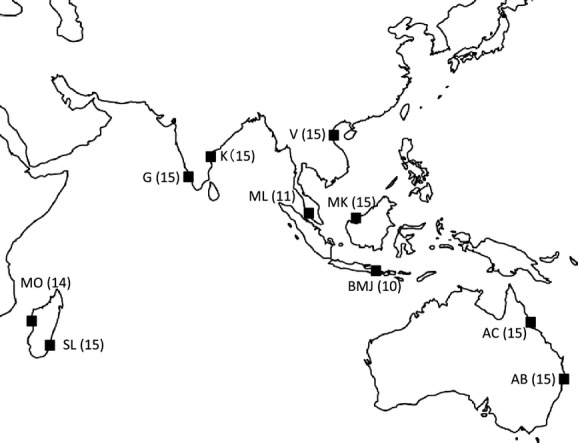
Sampling locations of the 10 populations. Populations are indicated by abbreviations. Number of individuals used in this study is shown in parentheses.

Sampling locations of the 10 populations. Populations are indicated by abbreviations. Number of individuals used in this study is shown in parentheses.