
Figure 2.
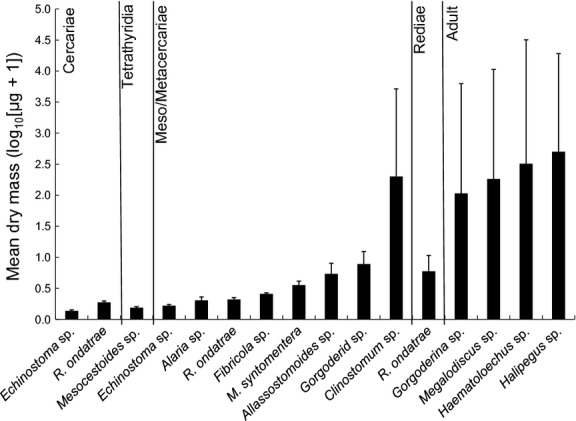
Average dry mass of each species of parasite separated by life stage. Mass values are reported as log10[μg+1] transformed values and the error bars indicate log10[μg+1] standard error.
Official websites use .gov
A
.gov website belongs to an official
government organization in the United States.
Secure .gov websites use HTTPS
A lock (
) or https:// means you've safely
connected to the .gov website. Share sensitive
information only on official, secure websites.
Average dry mass of each species of parasite separated by life stage. Mass values are reported as log10[μg+1] transformed values and the error bars indicate log10[μg+1] standard error.