
Figure 6.
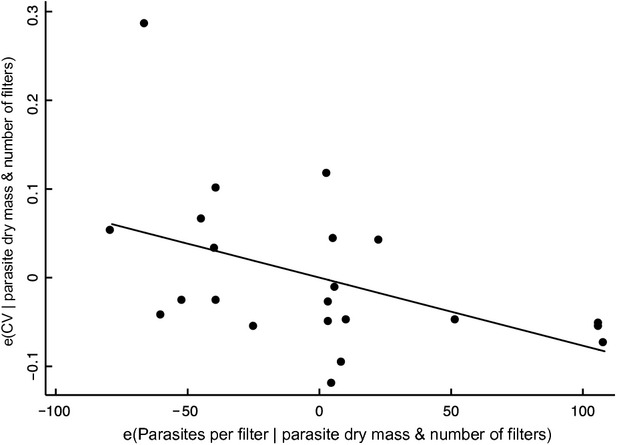
Adjusted variable plot showing the relationship of parasites per filter and the coefficient of variation of the mean adjusting for the number of filter replicates and the mass of the parasite. The slope of −0.00077 (P = 0.038) is equivalent to the parasites per filter coefficient observed in a multiple linear regression of CV on parasites per filter, mass of parasites and number of filters (Supplemental Information).