
Figure 2.
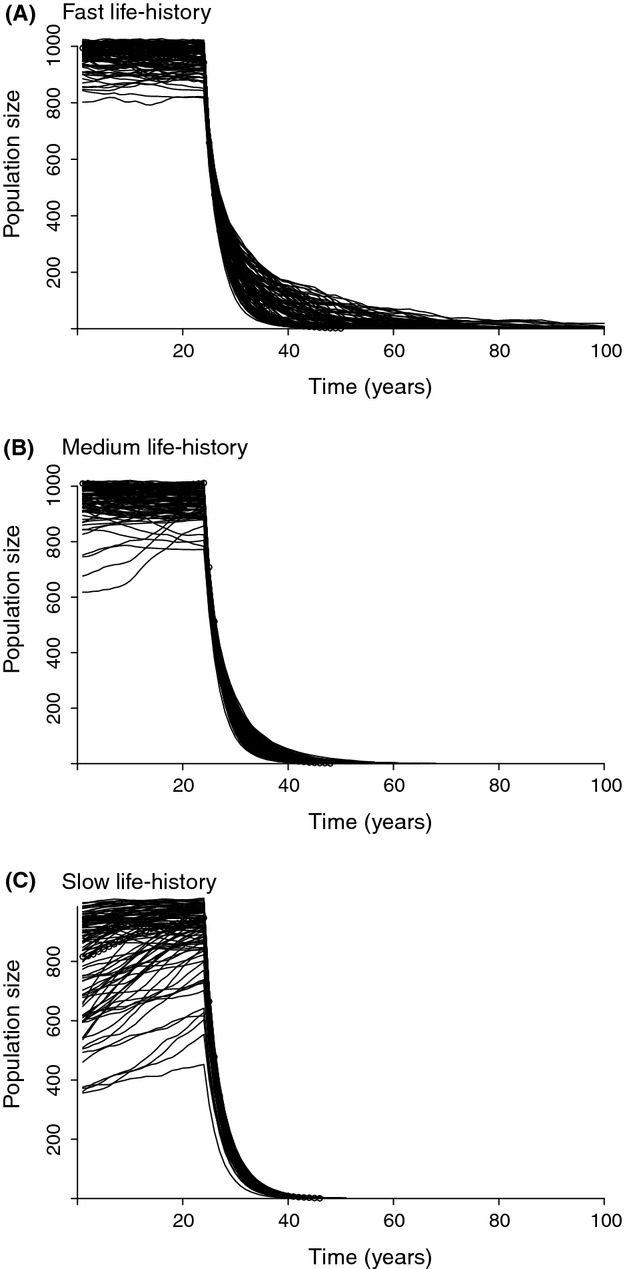
Illustration of 100 simulations of populations with (A) fast, (B) medium, and (C) slow life-history speeds under 30% proportional pressure, with coefficient of variation (C.V) in K of 0.01. Pressure was applied from year 25 onwards.
Official websites use .gov
A
.gov website belongs to an official
government organization in the United States.
Secure .gov websites use HTTPS
A lock (
) or https:// means you've safely
connected to the .gov website. Share sensitive
information only on official, secure websites.
Illustration of 100 simulations of populations with (A) fast, (B) medium, and (C) slow life-history speeds under 30% proportional pressure, with coefficient of variation (C.V) in K of 0.01. Pressure was applied from year 25 onwards.