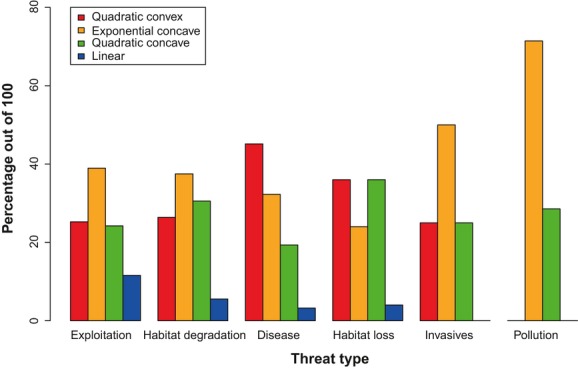
Figure 5.

Distribution of decline curves according to threatening process (based on percentage identified out of all decline curves ascribed with the same threat type; N.B. multiple threats were reported for each population time-series). N = 95 decline curves affected by exploitation, 72 by habitat degradation or alteration, 31 by disease, 25 by habitat loss, eight by invasive species or genes, and seven by pollution.
