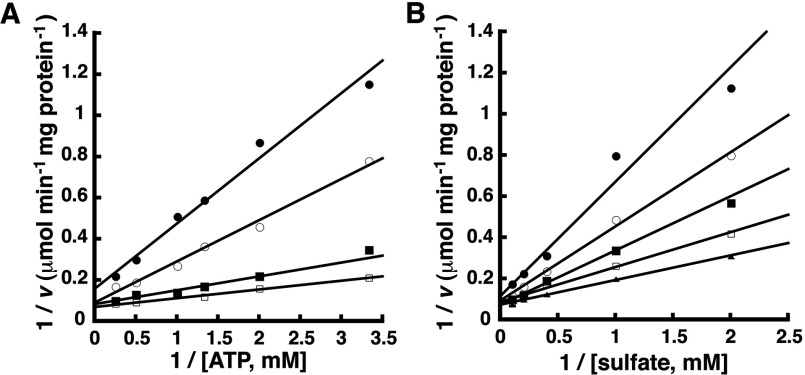
Figure 2. Initial velocity variation of substrates in the forward reaction.
Experimental data are shown as symbols in the double-reciprocal plots and lines indicate the global fit of all data to the equation for an ordered sequential bi bi mechanism. (A) Double-reciprocal plot of 1/v versus 1/[ATP] at 0.5, 1.0, 2.5 and 5 mM sulfate (top to bottom). (B) Double-reciprocal plot of 1/v versus 1/[sulfate] at 0.3, 0.5, 0.57 and 1.2 mM ATP (top to bottom).

