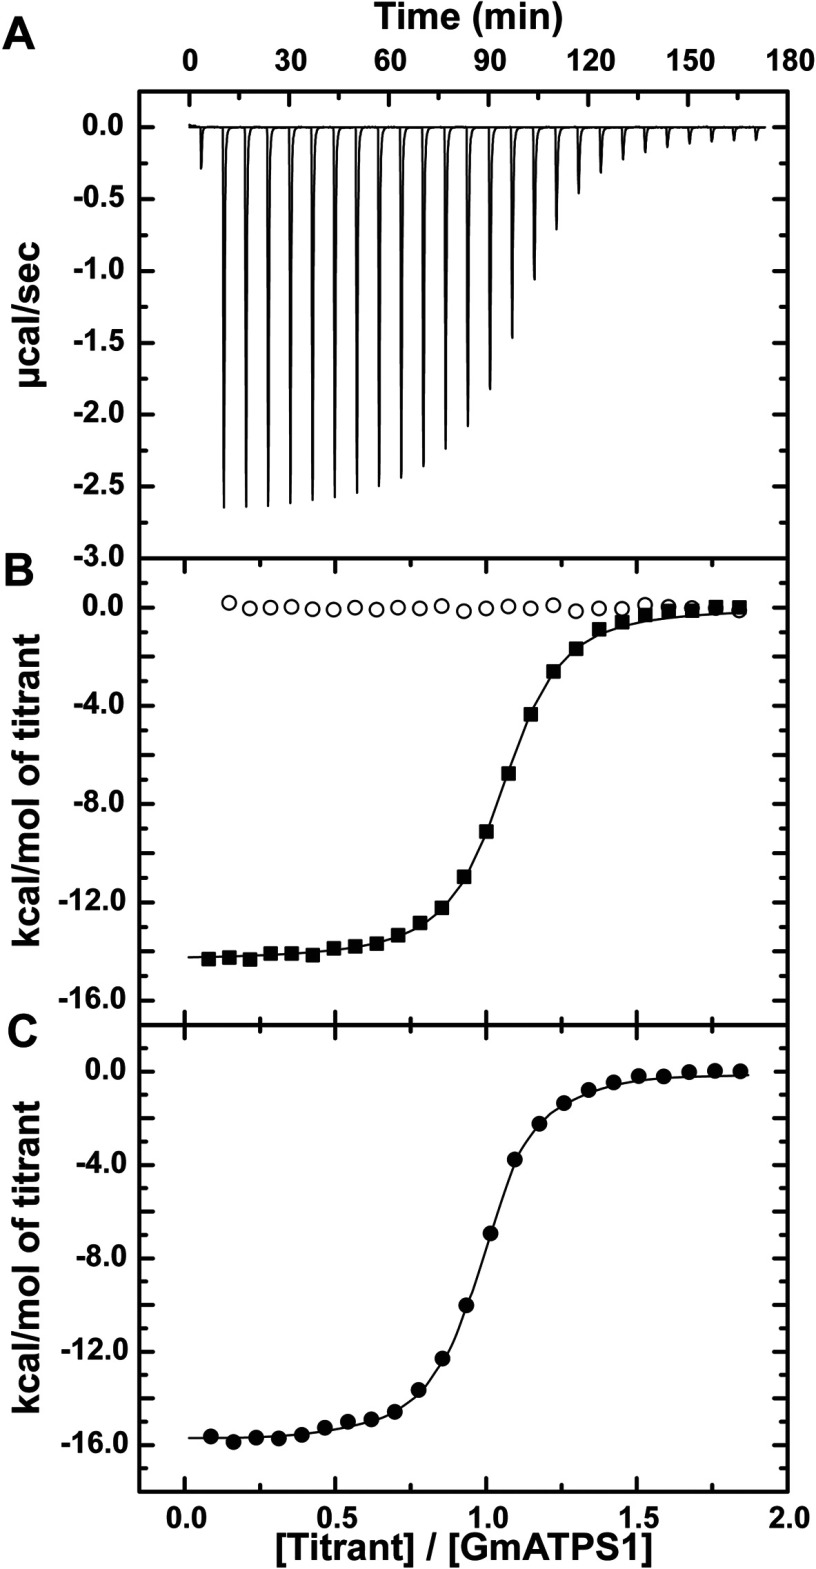
Figure 5. ITC analysis of ligand binding to GmATPS1.
(A) Representative experimental data for the APS titration is plotted as heat signal (μcal s−1) versus time (min). Each experiment consisted of 20–30 injections of 10 μl each of ligand into a solution containing protein. (B) Titration of GmATPS1 with APS (solid squares) and PPi (open circles). The integrated heat response is shown with the solid line representing the fit of the data to a one-site binding model. (C) Titration of the GmATPS1•APS complex with PPi. The integrated heat response is shown with the solid line representing the fit of the data to a one-site binding model.

