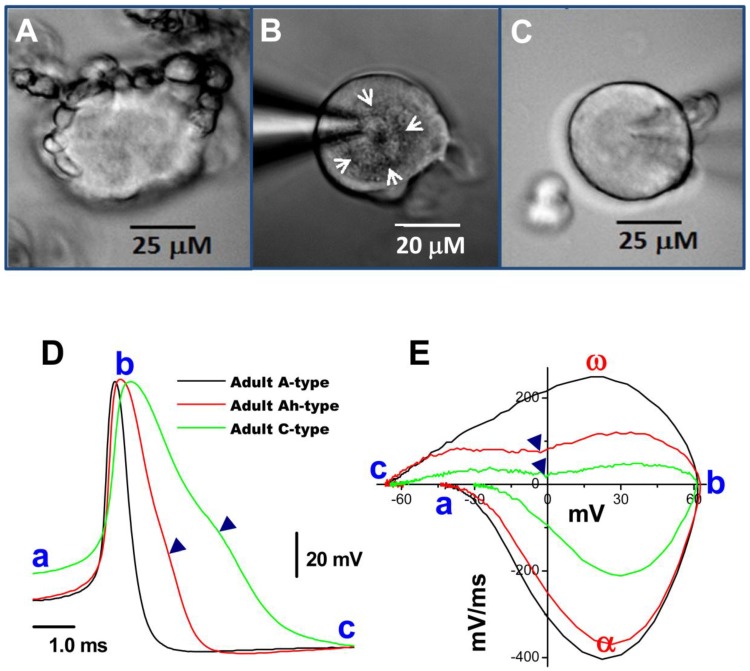
Figure 2.
Bright field images of myelinated A- and unmyelinated C-type nodose neurons isolated from adult rats. A: A-type; B: Ah-type; C: C-type. Adult nodose neurons were cultured for less than 10 hours; D: APs recorded from the same neurons shown in (A), (B) and (C); E: phase plots created from APs shown (A)-(C); in the phase plot, a - c indicate the APFT, the peak of AP, and the minimum voltage of the AHP, respectively; α & ω indicate points of maximal upstroke velocity, e.g. total inward currents and downstroke velocity, e.g. total outward currents, respectively. (▼) in either (D) & (E) indicates the voltage at which the repolarization hump occurs. White arrows indicate regions of roughed membrane appearance seen in Ah-type neurons in culture.

