
Figure 1. Identification of Small GTPases that Activate PI3K.
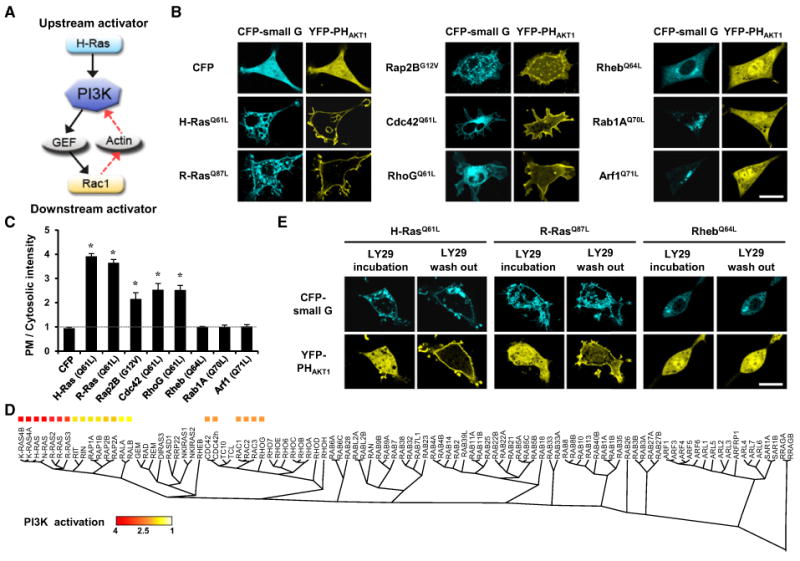
(A) Predicted roles of small GTPases in PI3K activation.
(B) YFP-PHAKT1 localization in NIH 3T3 cells coexpressing constitutively active small GTPases. Scale bar, 20 μm.
(C) Quantitative measurements of PIP3 production by line scan analysis of YFP-PHAKT1 localization. The PI3K activation index is the relative ratio of the fluorescence of the plasma membrane to the fluorescence of the cytosol: (FPM-FBG)/(FCyt-FBG), where F is the fluorescence intensity (FPM, plasma membrane; FBG, background; FCyt, cytosol). Data represent the mean ± SD (n = 5 experiments; * indicates p < 0.001 compared with control [CFP]).
(D) Phylogenic trees of the 100 human small GTPases. Homologies were analyzed with a Clustal WMSA algorithm. The relative amount of PI3K activation is color coded based on the PI3K activation index.
(E) Cells expressing constitutively active small GTPases were preincubated for 1 hr with LY29 (50 μM) to inactivate PI3K. The LY29 was then washed out toobserve the inducible activation of PI3K by small GTPases. Scale bar, 20 μm.