
Figure 3. Cooperative Positive Feedback from Rho Family Small GTPases to PI3K.
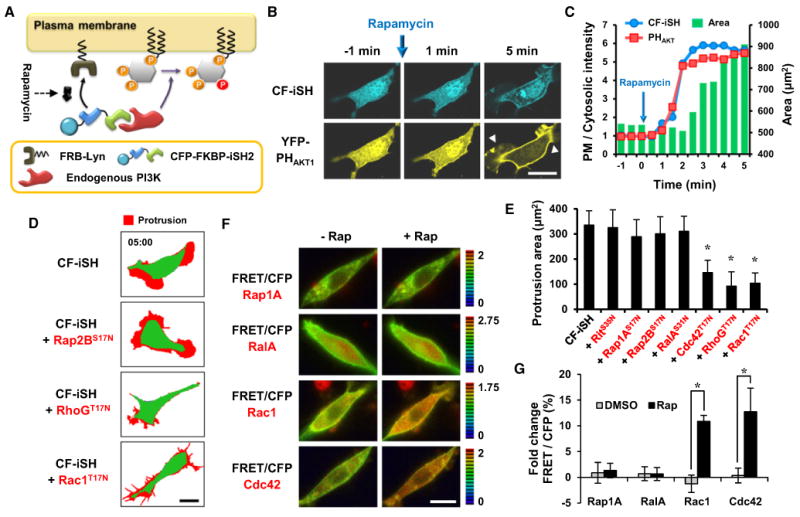
(A) Schematic diagram of the strategy used to activate endogenous PI3K.
(B) Endogenous PI3K activation was sufficient for YFP-PHAKT1 translocation and morphological changes within 5 min. Protrusions are indicated by yellow arrows. Scale bar, 20 μm.
(C) Time series of the translocation of CF-iSH and YFP-PHAKT1 to the plasma membrane. The change in cell area following endogenous PI3K activation is also shown. The y axis shows the ratio of plasma membrane fluorescence intensity to cytosolic fluorescence intensity and the total cell area (μm2).
(D) Protrusion (red) map after activation of endogenous PI3K in cells expressing dominant-negative small GTPases. Scale bar, 20 μm.
(E) Quantitative analysis of the protrusion area. Data represent the mean ± SD (n > 10; * indicates p < 0.001 compared with control [CF-iSH]).
(F) FRET/CFP ratio images show that Rac1 and Cdc42 are activated in response to rapamycin-induced endogenous PI3K activation but that Rap1A and RalA are not. Scale bar, 20 μm.
(G) Kinetic analysis of the percentage of fold change FRET/CFP ratio that was normalized to the initial ratio. Data represent the mean ± SD (n > 10; * indicatesp < 0.001).