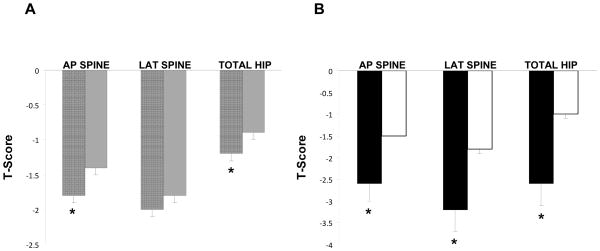
Figure 1. Differences in bone mineral density (BMD) based on level of plasma sodium.
T-scores were lower in women with anorexia nervosa with plasma sodium levels A) less than 140 (black stripes) compared to those equal to or greater than 140 (gray) and B) less than 135 (black) compared to those equal to or greater than 135 mmol/L (white), *p<0.01. Mean±S.E.M. AP, anterior-posterior.

