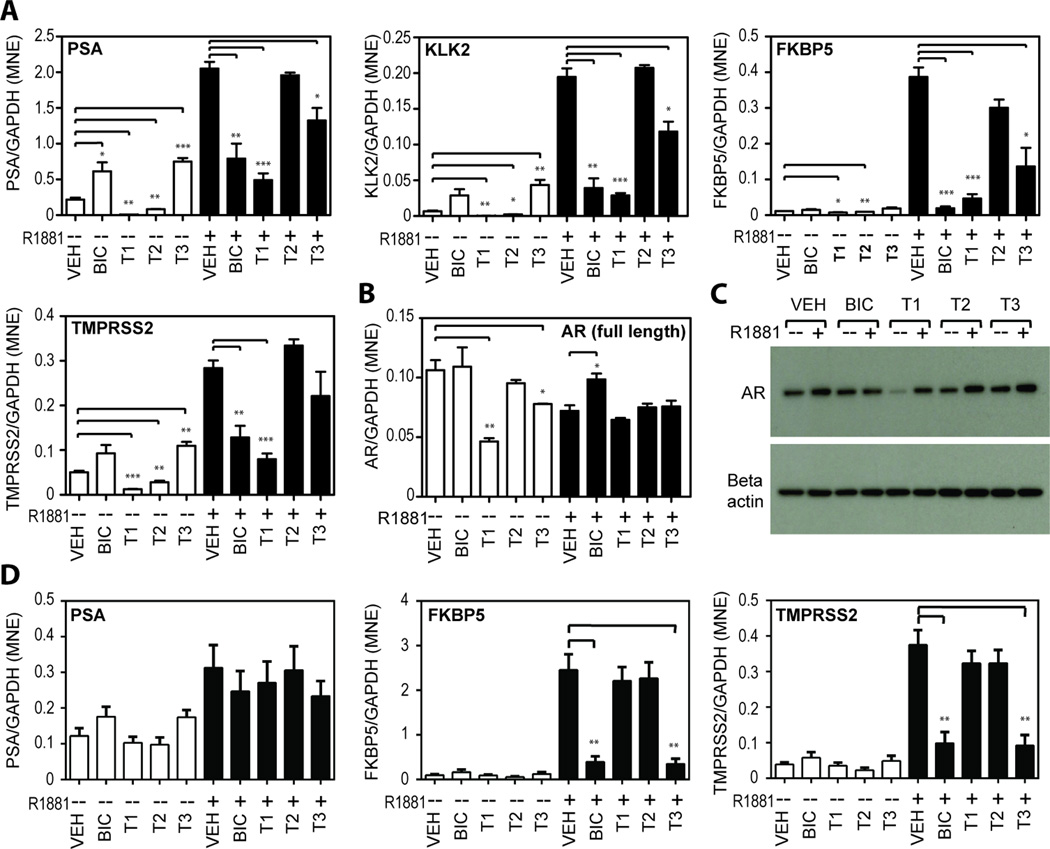
Figure 3. Reduction of endogenous expression of androgen-regulated genes.
(A) Levels of mRNA of four androgen-regulated genes (PSA, KLK2, FKBP5, and TMPRSS2) in LNCaP cells were measured by qRT-PCR. LNCaP cells were pre-treated for 1 hour with 10 µM of BIC, or T1, or T2, or T3, or vehicle (VEH), prior to the addition of 1 nM R1881 (black bars) or ethanol control (white bars) for 48 hr. Endogenous expression of AR in LNCaP cells under the same treatment conditions as mentioned above were detected by (B) qRT-PCR for AR mRNA levels and (C) Western blot analysis for AR protein levels. (D) Levels of PSA, FKBP5, and TMPRSS2 mRNAs were also measured in VCaP cells. Levels of expression of each gene were normalized to levels of GAPDH mRNA. Error bars represent the mean ± SEM, n = 3 separate experiments. Student’s t test: *p < 0.05; **p < 0.01; ***p < 0.001.

