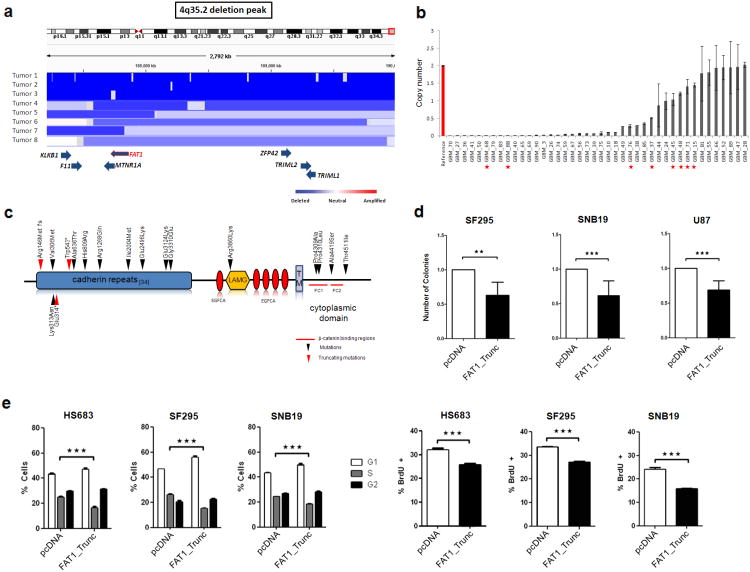
Figure 1. The FAT1 gene is deleted and mutated at a high prevalence across multiple human cancers, and FAT1 suppresses cancer cell growth and proliferation.
(a) Array CGH segmentation map showing select tumors with FAT1 deletions in the Tumorscape dataset (genomic coordinates at top). FAT1 and surrounding genes are indicated at bottom with blue arrows. Lower right, color legend showing copy number status.
(b) FAT1 copy number assayed via quantitative polymerase chain reaction in reference normal (red) and 42 glioblastoma samples (grey), demonstrating homozygous deletions in 24. Error bars represent 1 standard deviation. Red asterisks indicate tumors with FAT1 mutations. All assays performed in triplicate.
(c) Schematic of FAT1 is shown with locations of mutations. Arrowheads indicate the location of point mutations and boxes represent functional domains (TM, transmembrane; LAMG, laminin G domain; EGFCA, epidermal growth factor-like repeat; *, stop codon; fs, frameshift). Red arrows denote frameshift or truncating mutations. Red lines indicate putative β-catenin binding regions46.
(d) Colony-formation assays in indicated glioma cell lines demonstrate significant reduction in colony number when cells are transfected with FAT1_Trunc. Experiments performed in quadruplicate, colony number normalized to empty vector (pcDNA) = 1.0.
(e) Cell cycle analyses (left) demonstrate a significant reduction in S phase cells, in cells transfected with FAT1. BrdU assays (right) show a reduction in DNA synthesis in cells transfected with FAT1. Cell lines indicated. Experiments performed in triplicate. Error bars represent 1 standard deviation.
*p<.05, **p<.01, ***p<.001, t-test and ANOVA.

