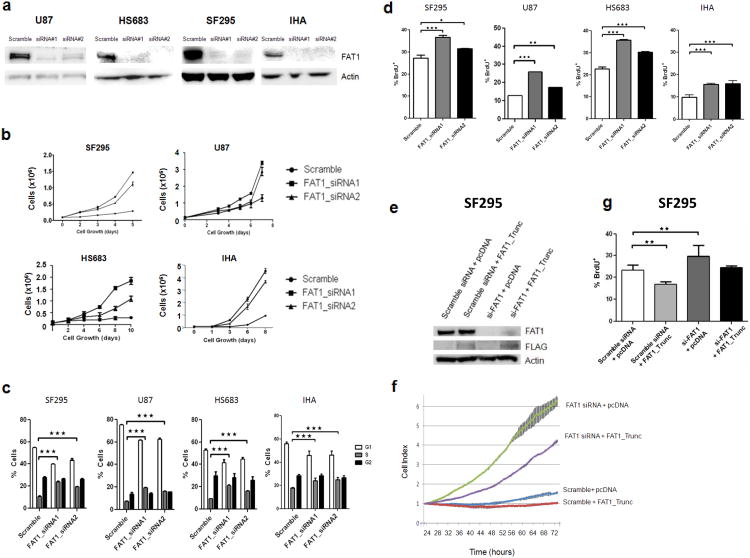
Figure 3. FAT1 inactivation results in increased cancer cell growth and proliferation.
(a) Western Blots demonstrating knockdown of FAT1 expression with 2 siRNAs in the indicated cells. “Scramble” is non-targeting siRNA.
(b) Cell growth curves demonstrating increased growth with FAT1 knockdown, in indicated cells. Experiments performed in triplicate.
(c) Cell cycle analysis reveals increased number of cells entering S phase after FAT1 knockdown. Indicated cell lines were either treated with one of 2 FAT1 siRNAs or scrambled siRNA control, in triplicate.
(d) BrdU incorporation assays reveal increased DNA synthesis after FAT1 knockdown. Experiments performed in triplicate. Error bars represent 1 standard deviation.
(e) Western blot demonstrating concomitant FAT1 knockdown with siRNA, and FAT1_Trunc construct transfection, in SF295 cells. Antibodies indicated.
(f) Growth curve demonstrating accelerated growth after FAT1 knockdown, partially reversed with concomitant transfection of FAT1_Trunc, in SF295 cells. Error bars represent 1 standard deviation. Experiments performed in quadruplicate. Cells were plated for xCELLigence growth curve 24 hours after transfection, and data shown at the start of cell proliferation (see Methods).
(g) BrdU incorporation assay reveals increased DNA synthesis after FAT1 knockdown, reversed after concurrent FAT1_Trunc overexpression. Experiments performed in triplicate. Error bars represent 1 standard deviation.
*p<.05, **p<.01, ***p<.001, Fisher's exact test and one-way ANOVA.

