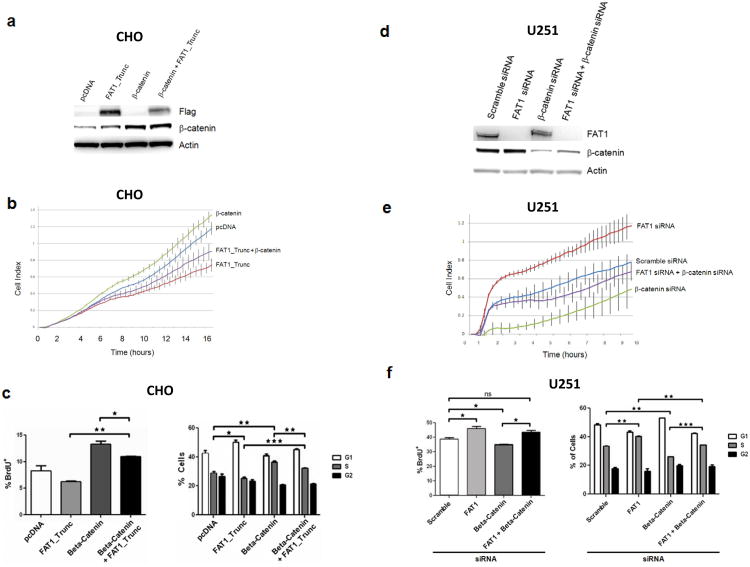
Figure 5. Functional relationship between β-catenin and FAT1 in the regulation of proliferation.
(a) Western blot showing co-transfection of β-catenin and FAT1 in chinese hamster ovary (CHO) cells.
(b) Growth curve demonstrating accelerated cell growth with over-expression of β-catenin, repressed with co-transfection with FAT1. Error bars represent 1 standard deviation. Experiments performed in CHO cells, in quadruplicate.
(c) BrdU (left) and cell cycle (right) assays demonstrate enhancement in DNA synthesis and cells entering S phase, after β-catenin over-expression, repressed with FAT1 co-transfection. Experiments performed in CHO cells, in triplicate.
(d) Western blot showing co-transfection of siRNAs targeting FAT1 and β-catenin, in U251 glioma cells.
(e) Growth curve demonstrating accelerated growth after FAT1 knockdown, reversed by concurrent knockdown of β-catenin. Error bars represent 1 standard deviation. Experiments performed in quadruplicate, in U251 glioma cells.
(f) BrdU (left) and cell cycle (right) assays demonstrate enhancement in DNA synthesis and cells entering S phase, after FAT1 knockdown, repressed with concurrent β-catenin knockdown, in U251 glioma cells. Experiments performed in triplicate. These data are shown with a 2nd set of siRNAs in Supplementary Fig. 3.
*p<.05, **p<.01, ***p<.001 ANOVA.

