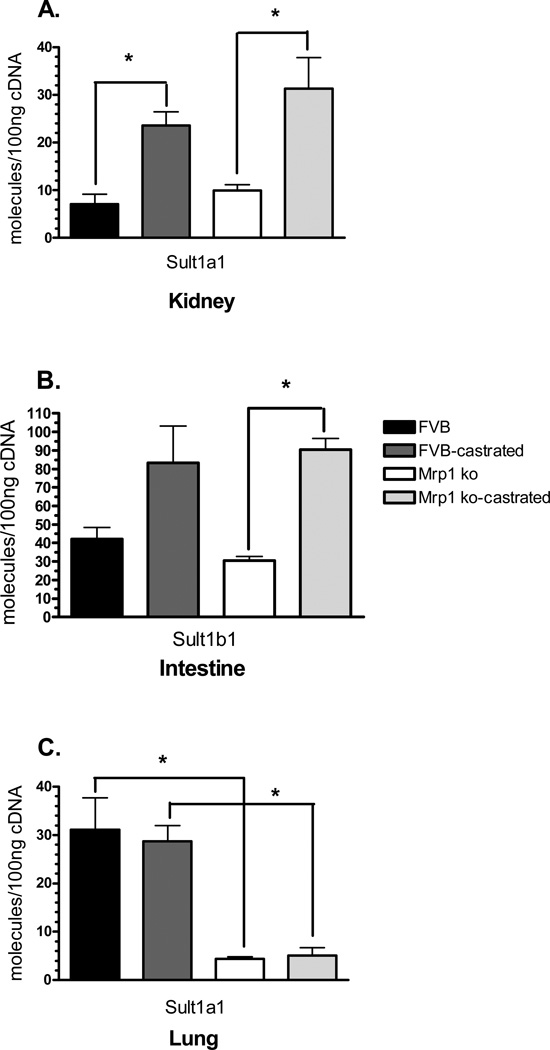
Figure 3.
mRNA levels of Sults in the kidneys, lung, and small intestine. mRNA levels were determined by qPCR using primers specific for Sult1a1 or Sult1b1. Samples (n = 3) were run in triplicate and repeated twice. Data are expressed as copy number per 100 ng cDNA ± SD normalized to Gapdh. Statistical differences (*) were determined by ANOVA followed by Tukey’s test (P < 0.05). Sult1a1 is expressed in only in the kidney (A) and lung (C). Sult1b1 is only expressed in the intestine (B).

