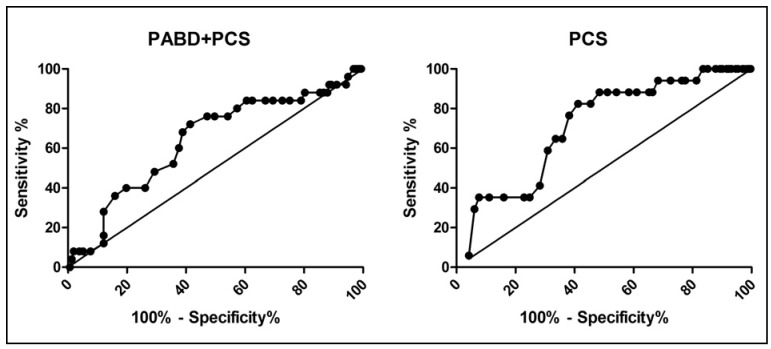
Figure 1.
ROC curve of basal haemoglobin concentration.
ROC curves with the basal haemoglobin concentrations of transfused and non-transfused patients was built for the PABD+PCS and PCS groups. For both transfusion strategies, basal haemoglobin concentration was predictive of transfusion, as it differed significantly from the non-discriminating test (straight line: identity). PABD+PCS: P <0.05; PCS: P <0.01.

