
Figure 1.
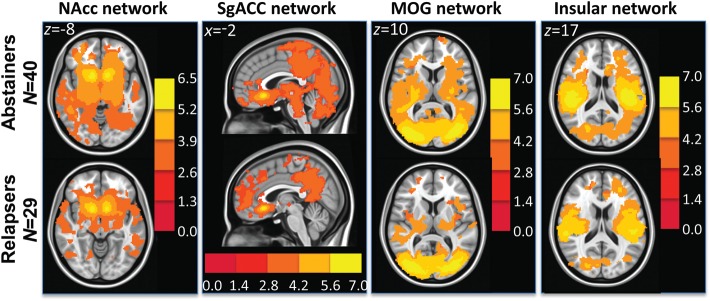
t-Maps showing within group t-test results in abstainers (top row) and relapsers (bottom row) in the NAcc (reward), sgACC (executive control), middle occipital gyrus (MOG) (visual), and insular networks.
Official websites use .gov
A
.gov website belongs to an official
government organization in the United States.
Secure .gov websites use HTTPS
A lock (
) or https:// means you've safely
connected to the .gov website. Share sensitive
information only on official, secure websites.
t-Maps showing within group t-test results in abstainers (top row) and relapsers (bottom row) in the NAcc (reward), sgACC (executive control), middle occipital gyrus (MOG) (visual), and insular networks.