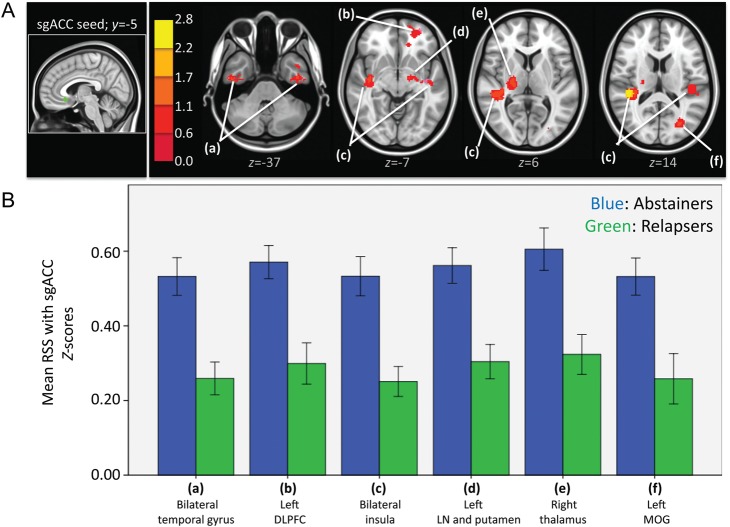
Figure 3.
(A) Left: sgACC seed in green. Right: Resulting t-map showing regions in which abstainers had significantly higher strength of RSS than relapsers within the sgACC network. t-Map is overlaid on a MNI brain in radiological orientation (right is left). (B) Bar graphs (with ±1 standard error bars) showing strength of RSS between sgACC and regions with significant differences between abstainers (blue bars) and relapsers (green bars). ANCOVA analysis showed that differences in all regions showed were still significant after controlling for noise (see F and Sig. values in Table 6B). RSS, resting-state synchrony; sgACC, subgenual anterior cingulate cortex; DLPFC, dorsolateral prefrontal cortex; LN, lentiform nucleus; MOG, middle occipital gyrus.

