
Figure 1.
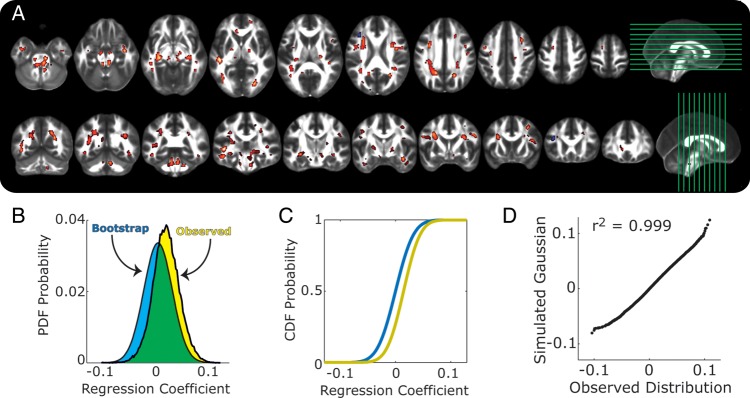
Shown are associations between years of schooling and fractional anisotropy (FA). (A) Clusters of voxels where increased years of schooling exhibited associations with FA. Warm-colored voxels reflect positive associations, and cool-colored voxels show negative associations. Side panels show slice placements. All voxels were adjusted for multiple testing at the cluster level, with a minimal cluster size of 20 voxels. (B) Probability density functions of regression coefficients for the total effects of schooling on FA, after controlling for age and sex. Yellow shows the observed distribution, and the blue shows the average distribution from the bootstrap permutation tests. (C) Cumulative distribution functions for the same data as in B. Same color terms used for observed and bootstrapped data. (D) Q–Q plot comparing the observed distribution in B to a Gaussian distribution with the same mean and variance.