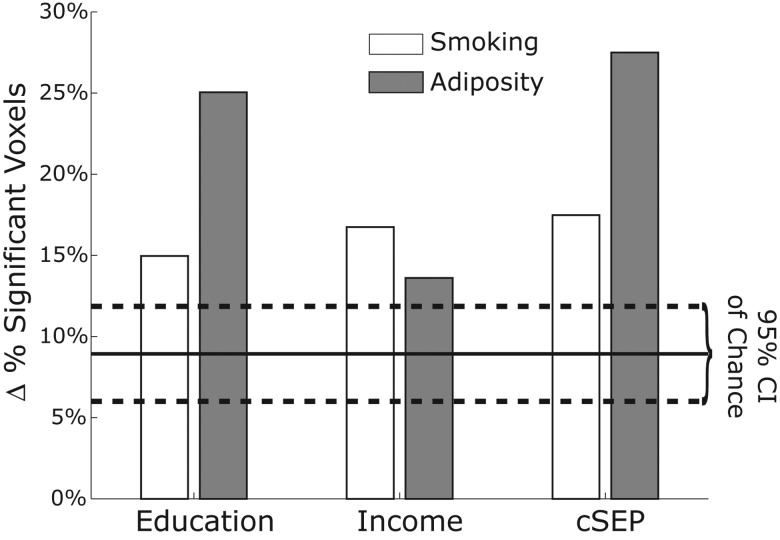
Figure 6.
Change in the percent of significant voxels for each indirect path shown in Figure 5A when the CRP term is included as a covariate in the model. Dashed lines show the upper and lower 95% CIs from the control analysis, wherein a random noise term was included instead of CRP. Solid line shows the mean value of these control analyses. Percentages are from all white matter voxels. Change from within the subset of originally significant voxels is reported in the text.

