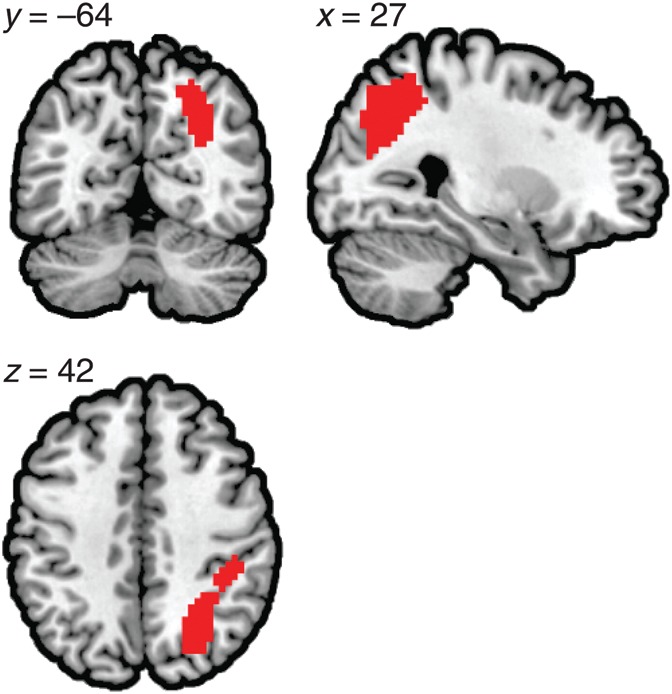
Figure 3.

The conjunction of the 3 contrasts which served as a candidate region for the individual seed for the subsequent PPI connectivity analyses.

The conjunction of the 3 contrasts which served as a candidate region for the individual seed for the subsequent PPI connectivity analyses.