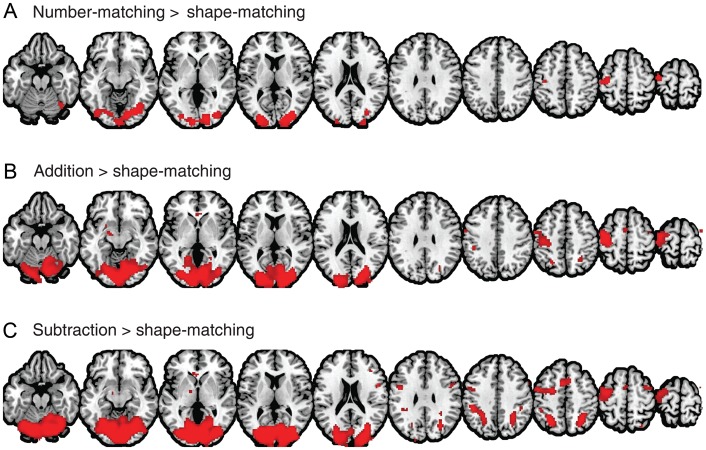
Figure 4.
PPI maps of number-matching (A), addition (B), and subtraction (C) contrasts. Each of these maps shows regions with a greater time-course correlation with the number-selective right parietal seed region during the experimental condition compared with the control (shape-matching) condition.

