
Figure 1.
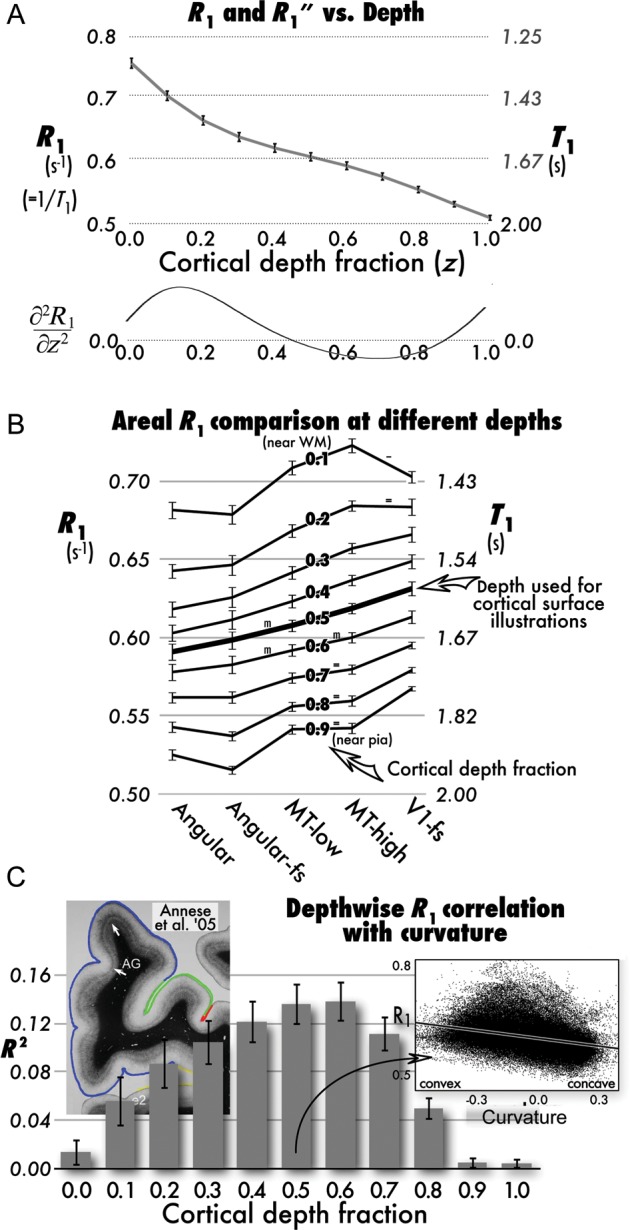
Relaxation rate (R1) as function of cortical depth, area, and curvature. (A) Overall cortical average R1 (equivalent T1 on right y-axis) decreases monotonically from gray–white boundary (depth fraction 0.0) to a slight plateau at middle depths (0.3–0.6, beginning where second derivative in lower graph crosses zero), and then resumes its decrease in superficial layers (0.7–1.0; error bars: ±1 standard error of the mean over subjects). (B) Cross-ROI differences in average cortical R1 shown as line for 8 depths (from 0.1 near white matter to 0.9 near pia); y-axes, error bars as in (A); ROIs: Angular (angular gyrus), angular-fs (FreeSurfer angular gyrus label), MT low and MT high [non-overlapping low- and high-probability MT labels (Malikovic et al. 2007; Fischl et al. 2008), V1-fs (FreeSurfer V1)]. All matched-paired t-tests on hypothesized differences significant (P < 0.05) except where marked “m” (P < 0.1), “=” (no significant difference), or “-” (difference opposite prediction). (C) Vertex-wise correlation (adjusted R2) of R1 and curvature as function of depth (error bars as before over subjects). Scatter plot inset at right is from a single subject at depth 0.5. For comparison, left inset shows myelin-stained section of human cortex with reduced myelination in concave areas (compare 2 white arrows, from Annese et al. 2004).